



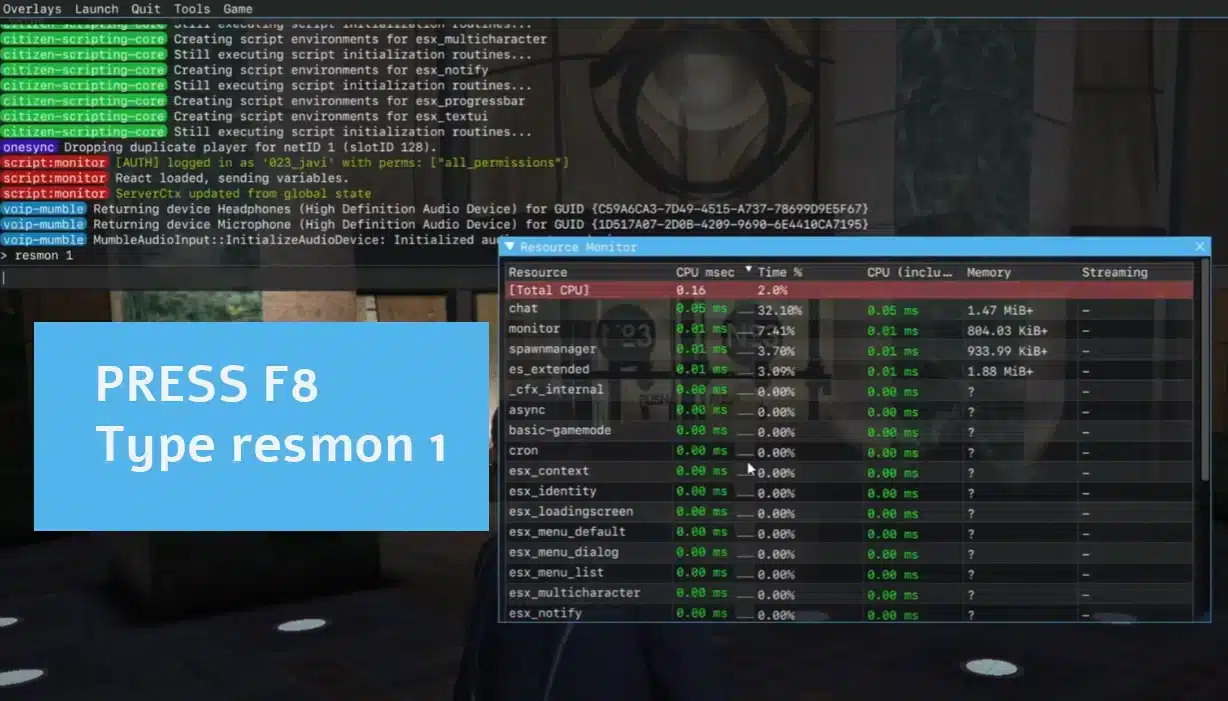
Fast answer: Resmon is FiveM’s client-side resource monitor. Open the F8 console and run resmon true to inspect resource cost on the client. Use it to find expensive scripts, maps, HUDs, and UI resources before guessing what causes low FPS.
Last updated: June 25, 2026
Open Resmon
- Join your server.
- Press
F8. - Run:
resmon trueIf access is denied, the Cfx.re documentation notes that developer mode may be required for some diagnostics. Test on a development client or use the profiler for deeper debugging.
What Resmon tells you
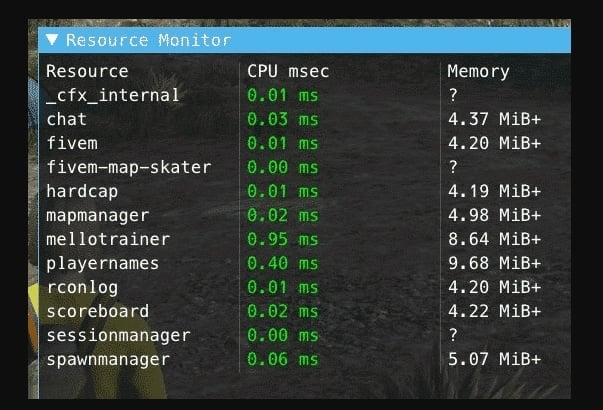
| Column/signal | Meaning |
|---|---|
| CPU msec | How much client CPU time a resource consumes. |
| Memory | How much memory the resource uses on the client. |
| Spikes | Short bursts that may happen during UI, streaming, or loops. |
| Constant high cost | A resource that likely needs code or asset work. |
Practical test method
- Stand in a quiet location and note the top expensive resources.
- Move to a busy city area, MLO, or vehicle-dense location.
- Open menus, inventory, phone, HUD, and job UI one at a time.
- Record which resource spikes and what action caused it.
- Disable one suspect resource in staging and repeat the same test.
When to use the profiler
Use Resmon for quick triage. Use the Cfx.re profiler when you need line-level or deeper resource debugging. The profiler is better when a resource is consistently expensive but the reason is not obvious from gameplay.
Common causes of high Resmon values
- Loops without enough
Wait()time. - NUI scripts that update every frame.
- Large map or clothing packs near dense areas.
- HUDs checking too many player states too often.
- Client events doing server-style work.
Related optimization guides
- FiveM server optimization
- How to show FPS in FiveM
- Fix FiveM thread hitch warnings
- Official Cfx.re profiler guide
How to read Resmon without overreacting
A short spike is not always a bug. Opening a phone, inventory, clothing menu, or map can briefly cost more CPU. The problem is a resource that stays expensive while idle or spikes every few seconds during normal play.
Useful testing notes
- Test with the same route through the city each time.
- Write down the top three resources before changing anything.
- Disable one suspect resource at a time.
- Retest after a full restart, not only a hot reload.
- Check both low player count and busy player count.
Developer fixes that usually work
Increase waits in loops, avoid constant NUI updates, cache repeated lookups, move server-only work out of client code, and stop checking every player state every frame. If a script needs to react to events, use events instead of polling when possible.
How to decide what to fix first
Do not remove random resources because one number looks high for a moment. First test the same route through the city, write down the top three expensive resources, then change one thing at a time. A phone, inventory or clothing menu may spike only while open; that is different from a script that stays expensive while the player is idle.
Common fixes developers should check
- Increase waits in loops that do not need every-frame checks.
- Cache repeated player, vehicle or entity lookups.
- Reduce constant NUI messages from HUD and phone resources.
- Move server-only validation out of client loops.
- Use events where polling is only a convenience.
What Resmon cannot prove
Resmon is client-side. It helps identify resources that cost a player’s frame time, but it does not replace server logs, database profiling or txAdmin monitoring. A resource can look cheap on the client and still create server-side database pressure. Use Resmon for client feel, then use server tools for backend issues.
Before and after notes
Take a screenshot or write down msec values before changing code. After each fix, retest the same route with the same player count if possible. Without a repeatable test, performance work becomes guessing.
When the problem is intermittent, record the time, player count and location. That helps compare Resmon data with txAdmin logs and recent resource changes.
For shared teams, keep one small performance log so developers can see what changed before the spike appeared.
Good notes make optimization faster than guesswork.
They also make it easier to roll back the exact resource update that caused the regression.
Keep the notes short enough that staff will actually use them.